Stats in a nutshell part 2: Skewers and Deviance

Last time we talked about the most misused descriptive statistic there is, the all-powerful average. Today, we take a quick look at the descriptive statistics you don't see in the news that much and give us a much better picture of the data: Skewness and Standard Deviation.
What are they?
If averages tell us where the center of a dataset is, standard deviation and skewness tell us what the shape of that data looks like. They answer two quiet but crucial questions:
- How spread out are the values?
- Are they balanced… or lopsided?
Without them, averages can be deeply misleading.
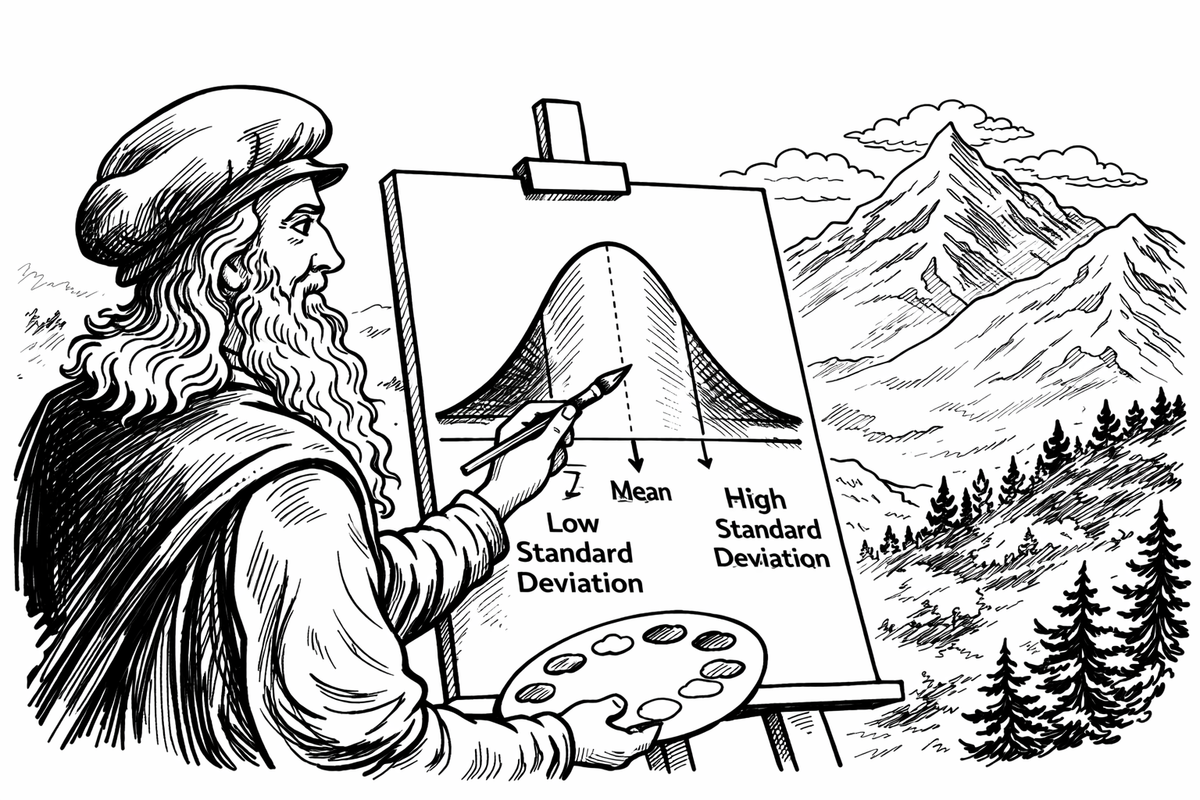
Standard Deviation: How Similar Are We, Really?
Standard deviation (often shortened to SD) measures how much people in a group differ from one another.
Two classrooms might both have an average test score of 75.
But one classroom might have everyone clustered tightly between 70 and 80.
The other might have half the class scoring 95 and the other half scoring 55.
Same average. Very different realities.
The first class has a low standard deviation — people are similar.
The second has a high standard deviation — people are wildly different.
This matters in the real world. If a new drug lowers blood pressure by an average of 10 points, that sounds impressive. But if the standard deviation is huge, it might mean some people saw a big improvement, while others saw none at all — or even got worse.
The average tells you what happened in general.
The standard deviation tells you whether that general statement actually applies to most people.
When Standard Deviation Is Used Well
Think about income.
Two cities might both have an average income of $60,000. But one city might be full of people earning between $50k and $70k. The other might be split between a small number of millionaires and a large number of people scraping by.
The second city has a much higher standard deviation. It’s more unequal.
The average income didn’t change. The lived reality did.
That’s exactly what standard deviation is meant to reveal.
When Standard Deviation Misleads
Now imagine housing prices rise rapidly in a city. A wave of luxury apartments is built. The average home price jumps. So does the standard deviation.
Suddenly, journalists write that housing is becoming “more unequal.”
But here’s the problem: nothing about the original residents changed. They didn’t suddenly become poorer relative to one another. The distribution widened because something new was added to the top.
Once again:
The statistic changed. The lived reality didn’t.
Standard deviation reflects what’s in the dataset — not why it got there.
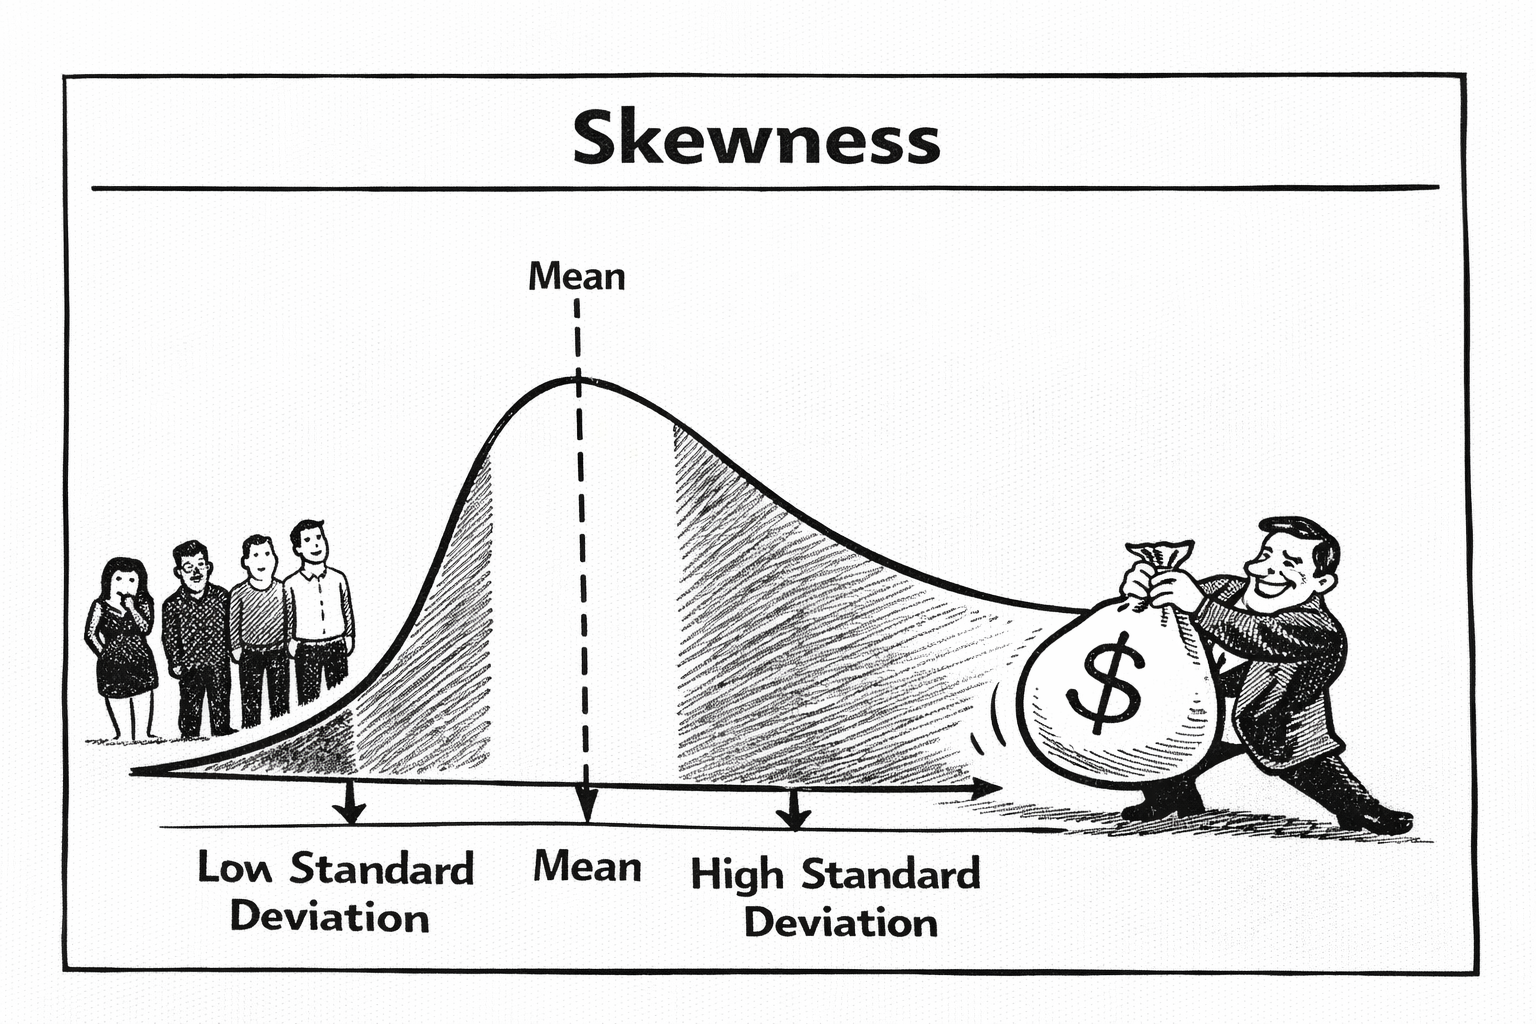
Skewness: Who’s Pulling the Average?
Skewness tells us whether data is evenly balanced around the average or pulled to one side.
Most people’s incomes cluster in the middle, with a long tail of very high earners. That’s called right-skewed. A small number of wealthy people pull the average upward, even though most people earn much less than that average.
That’s why average income can feel unrealistically high.
Skewness explains why.
When Skewness Is Used Well
Skewness is crucial in medicine and economics.
In healthcare, a few patients may have extremely long hospital stays while most stay only a few days. In finance, a few people may hold enormous wealth while most hold little.
Skewness tells us that the “average” person may not be typical at all.
When Skewness Is Misunderstood
Now imagine the tech sector booms. A handful of people become incredibly wealthy. Average income rises. Skewness increases.
News headlines celebrate rising incomes.
But most people didn’t get richer.
The distribution shifted because a few people did extraordinarily well. Once again, the number changed — not the lived experience.
Why This Matters
Averages tell us where the middle is.
Standard deviation tells us how wide the spread is.
Skewness tells us who is pulling the story.
Ignore any one of them, and you get a distorted picture of reality.
And the most dangerous distortions don’t come from bad math — they come from forgetting what the numbers actually represent.
Just like with averages:
The statistics can move even when people’s lives do not.
Understanding that difference is the first step toward seeing data clearly.