Stats in a nutshell part 3: The Story So Far

In part 1, we looked at how the average, usually the mean average, is used and misused in news headlines and in public discussions of big world issues (health, finance, society in general, etc...).
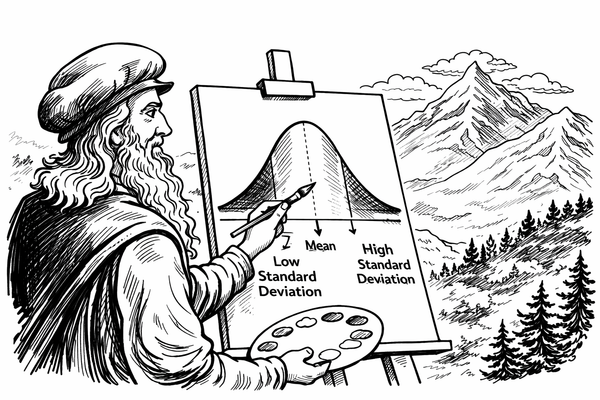
In part 2, I introduced the importance of standard deviation, showing the spread of data, and skewness, which helps us identify individual measures which might be moving the data one way or another:
- Averages help us identify what the middle value of the data is (median), the most common measurement in the data is (mode), and roughly what the middle value of the whole range of data might be (mean).
- Standard deviations show us if the data is closely packed together around the average or spread out across a large range of values.
- Skewness gives us an idea of whether or not the data is spread out evenly or if the outliers are dragging their side of the middle (either higher or lower) further away.
Why is this important?
Let me give you three things you might read in the headlines:
"The typical person..."
Public policies are often written to benefit the "typical" person, but I'll be honest with you... I've never met them. Taxes, healthcare subsidies, housing, infrastructure- these things all need look at income for a given area, but they look at the median and mean average, the distribution, and the skewness in order to be effective. Without skew or spread, policies might end up catering to someone who statistically exists, but in reality, does not.
"This stock has returned 7% annually for the past few years."
That stock you saw being pushed on TV, or in your favourite Wall Street podcast? Two stocks might both return the same annually, but one of them might swing wildly between huge wins and losses month by month, and the other might consistently gain small value bit by bit over time. Positively skewed investments might occasionally spike and give the opportunity for huge wins, whilst negatively skewed investments might dip dangerously low from time to time, only to miraculously recover at the last second.
"Treatments like this work 80% of the time."
I did not grow up in the USA, so living here now with the pharmaceutical commercials spewing out side-effects and success rates at high speed still makes my head spin. I think everyone I know has just become numb to them by now, but I haven't, and my statistical brain hasn't either. When I hear about a treatment working X% of the time, my mind is instantly asking "How skewed is the data on this drug?" or "How many people did they test it on?".
The answers might scare you, but the questions need to be asked.
The hidden mathematicians out there are farmers, who know better than to fixate on averages. A farmer doesn't care about average rainfall as much as droughts, frosts, floods, and other crazy weather events which threaten to kill their crops and ruin their harvests.
In a nutshell
Later in my series on "Stats in a nutshell", I will be talking about more advanced statistical methods such as risk models, machine learning, predictive algorithms, and econometrics; but none of them have any meaning without a good understanding of averages, standard deviations and skewness.