Portfolio
As a researcher and data manager, I know exactly how to utilize processing, visualization and multiple forms of analysis to bridge the gap between raw data and actionable intelligence.
Apps for calculation and interaction
R Shiny and Python
R Shiny and FlexDashboard online apps
I love to use R Shiny and FlexDashboard for lots of reasons. The customizability, numerous themes (via {bslib}) and simple structure of Shiny was appealing to me as it met all the criteria I have needed to create interactive data visualizations and calculation tools.
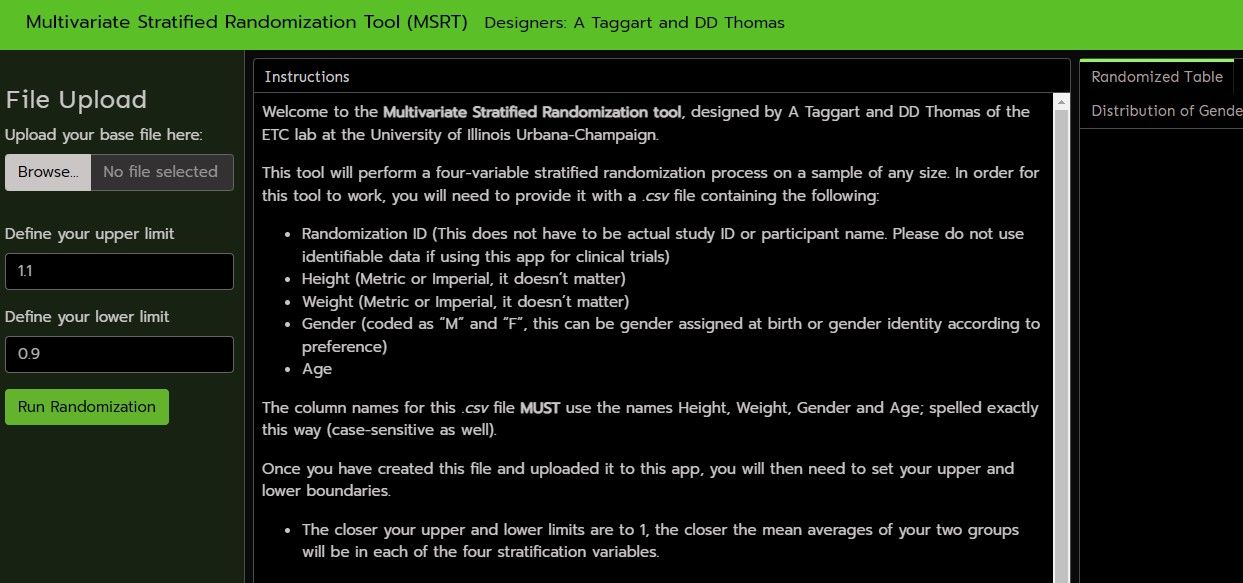
My most recent research-supportive application was the Multivariate Stratified Randomization Tool (MSRTool). I developed this with my friend and colleague Dave Thomas to address the serious problems in randomization protocols among researchers in the kinesiology and behavioral health fields. Often, researchers were still randomizing their trial groups with the flip of a coin, resulting in severely mismatched demographic or biometric averages between groups. Our first version of the MSRTool (shown below) takes a dataset with ID, Height, Weight, Age and Gender.
After setting your limits, a simple click of the button will randomize your participants into as homogenous groups as it is possible to make.
Visualization
An example case study using UFC data
The kind of data I work with on a daily basis is protected and confidential, so if I wanted to show you what I do with data, I'll need publicly available data to use as an example. Mixed Martial Arts (MMA) is a still developing sport with mixed and rich data available through multiple sources.
Let's run through what I could do with a mixed assortment of datasets showing information from the most well-known MMA syndication, the UFC:
1) The Data
Four Datasets were drawn from www.Kaggle.com. The largest file, "File_A", provides match information for all UFC fights between March 2010 and October 2021. A second file, "File_B", shows 11 more fights, also from October 2021, which were missing from File_A, and a third dataset "File_C" shows more fights which were (at the time) upcoming later that month.
2) Creating Profiles
Something of immediate value would be creating Athlete Profiles of every fighter in the combined UFC datasets. The largest file, File_A, could still be considered a medium-sized dataset at approx. 580,000 cells (between 1000 and 10000 rows, between 50 and 150 columns). The other two datasets have less than 500 cells each. At this level, and as a one-off, you could get away with copying and pasting data together.
BUT, assuming we would want to repeat this process when new data comes in, I will compile a simple script for merging both complete datasets (A and B), then creating another dataset populated with athlete profiles for every UFC fighter, showing totals and averages across multiple variables.
3) Visualizing the Data:
With the profiles created, it would help to see a typical UFC athlete profile and some highly correlated and relevant variables amongst all athletes before moving on to any kind of predictive modelling.
4) Predictive Machine Learning
My typical go-to for seeing if specific attributes, such as Height, Weight, Reach or Age, are predictive of an outcome variable would be a K-nearest neighbors approach BUT since we are trying to see how specific athletes might perform against one another, we need to transform the data into something more appropriate.
A two-pronged, for-looped KNN and LVA approach uses difference scores between "red" and "blue" fighters from the original merged dataset to predict both winner-loser, but also type of win (e.g. submission, KO, TKO)
The end result of this data process can be written into a convenient RMarkdown for others to replicate my process and see how I get from Step 1 to Step 4, as well as the useful data visualizations the process provides.
Computer Assisted Design (CAD)
Combining creativity, health technology and engineering
CAD is extremely good at what it does, and for someone like me who started as a hobbyist but then started to design real-world devices with health applications, it was the perfect way to experiment, fail repeatedly and eventually learn to bring a design out of the computer and into the real-world.
In 2019 I submitted the following design for a modular prosthetic leg to the UIUC health-make-a-thon, becoming one of the finalists in a competition of over 150 applicants. Unfortunately, my project did not receive funding or resources from the make-a-thon, but the feedback and guidance I received from engineers watching gave me the push I needed to keep designing:
